Vibration Apps

Vibration Analyzer

Load a vibration file and get a diagnosis: running speed, harmonics, sidebands, envelope analysis for bearing faults, and a Word report. Everything runs in your browser.

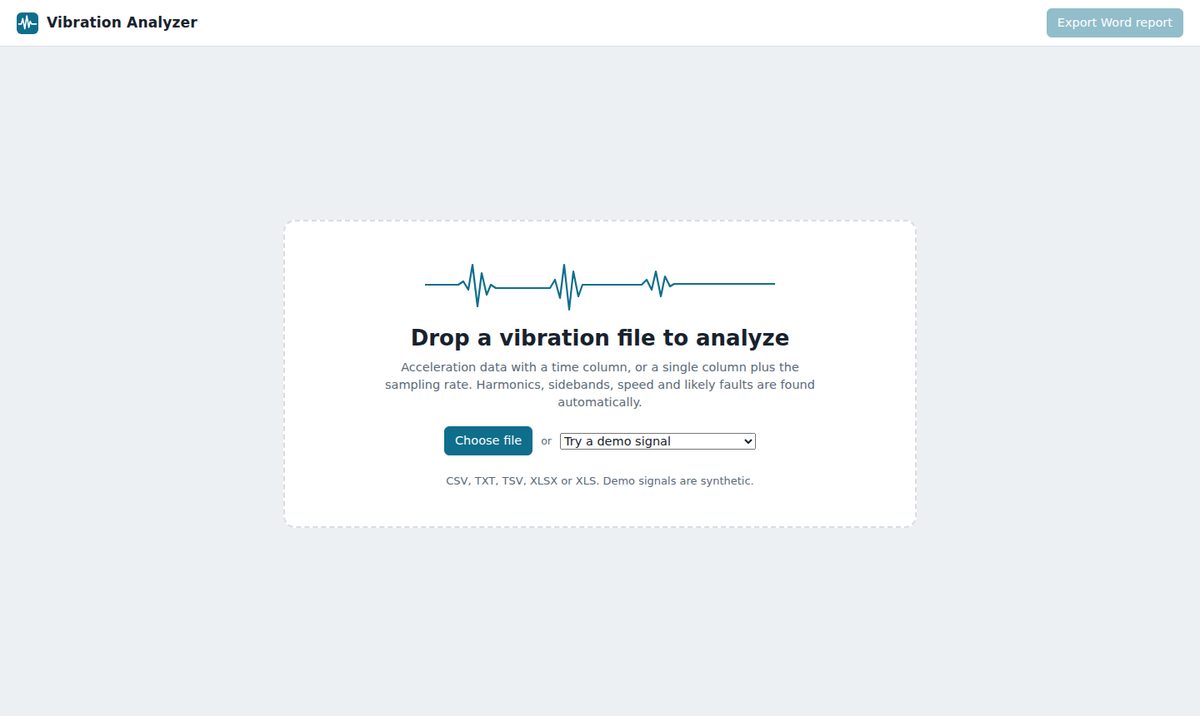
Screenshot: loading a vibration file

Step 1

Load your vibration data

Drop in a file and the analyzer reads it. Nothing is uploaded, all analysis runs in your browser.

  • CSV, TXT, TSV, XLSX or XLS files
  • A time column, or a single column plus the sampling rate
  • Choose units (g, m/s²), optional high-pass / low-pass filters, or analyze a selected range
  • Built-in demo signals: bearing, gearbox, looseness, unbalance, clipped sensor
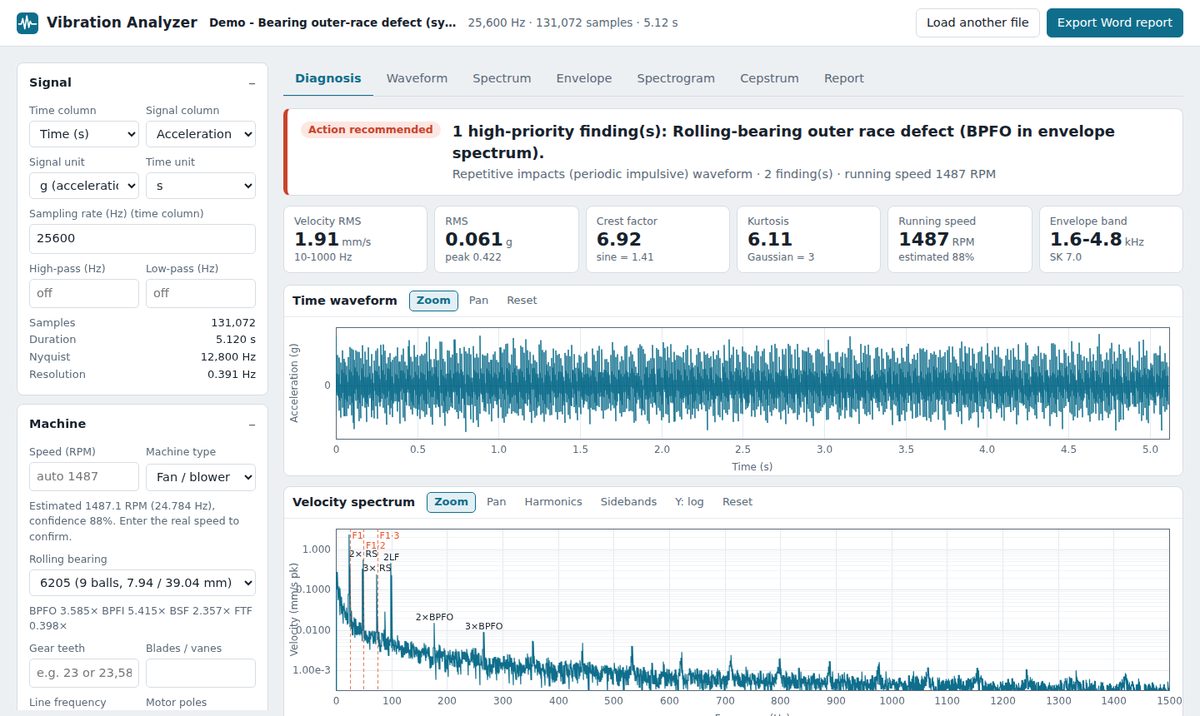
Screenshot: diagnosis tab showing a bearing outer-race defect

Step 2

Get an automatic diagnosis

Findings are ranked by priority, with the evidence behind each one.

  • Running speed estimated with a confidence level
  • Harmonic families and sidebands detected automatically
  • Velocity RMS, crest factor and kurtosis at a glance
  • Data-quality checks, such as a clipped sensor signal
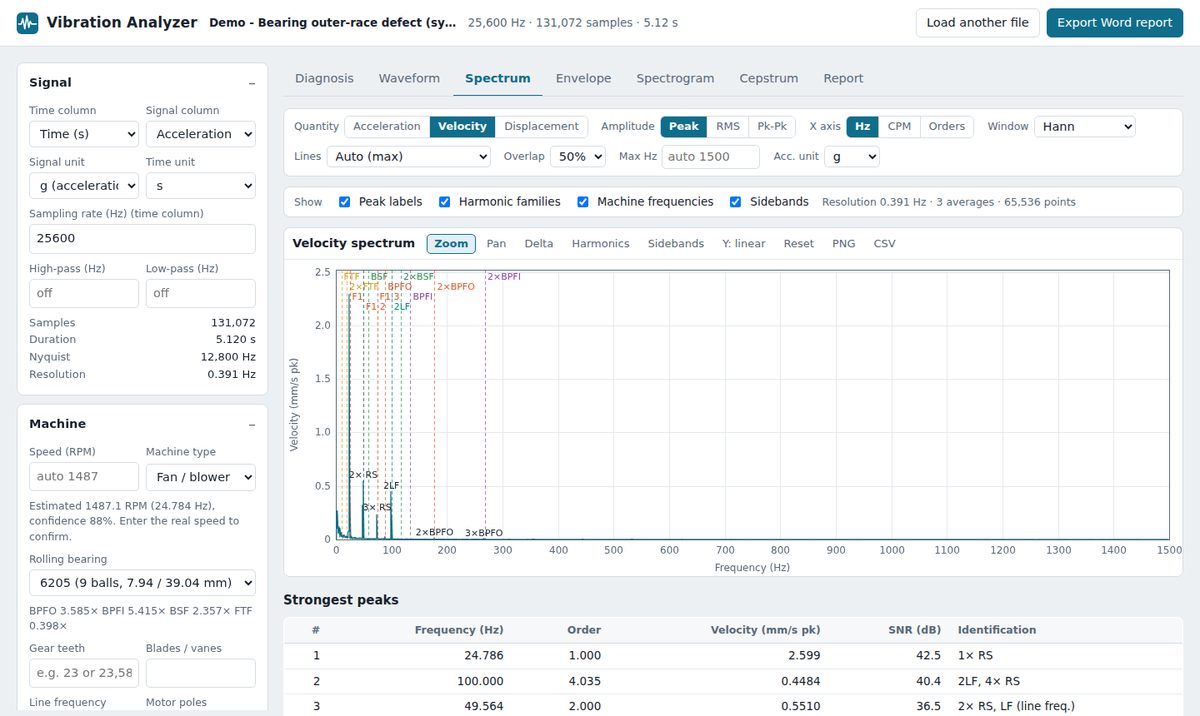
Screenshot: velocity spectrum with labelled peaks

Step 3

Explore the waveform and spectrum

Zoom and pan through the signal in acceleration, velocity or displacement.

  • Frequency axis in Hz, CPM or orders
  • Selectable window, resolution and averaging
  • Markers for harmonics, sidebands and machine frequencies
  • Strongest-peaks table for quick reading
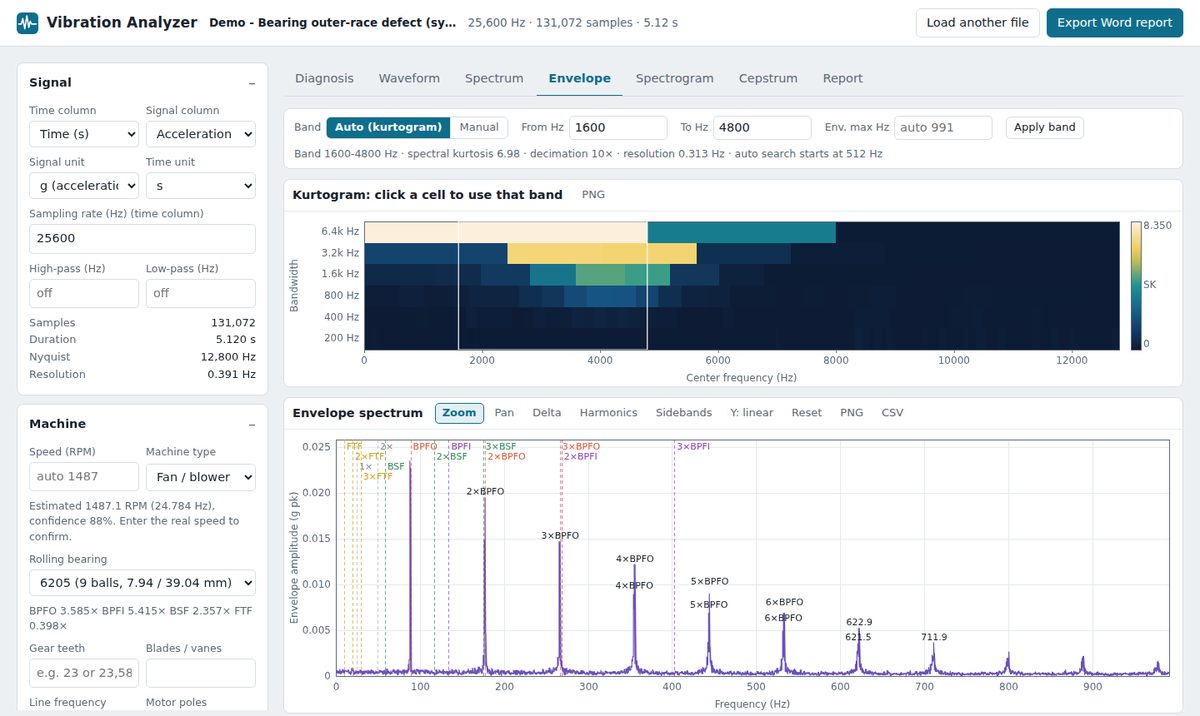
Screenshot: kurtogram and envelope spectrum

Step 4

Find bearing faults with envelope analysis

An automatic kurtogram picks the most informative band, then the envelope spectrum shows the fault frequencies.

  • BPFO, BPFI, BSF and FTF markers with harmonics
  • Pick a bearing from the list or enter its geometry
  • Click a kurtogram cell to try a different band
  • Export charts as PNG and peaks as CSV
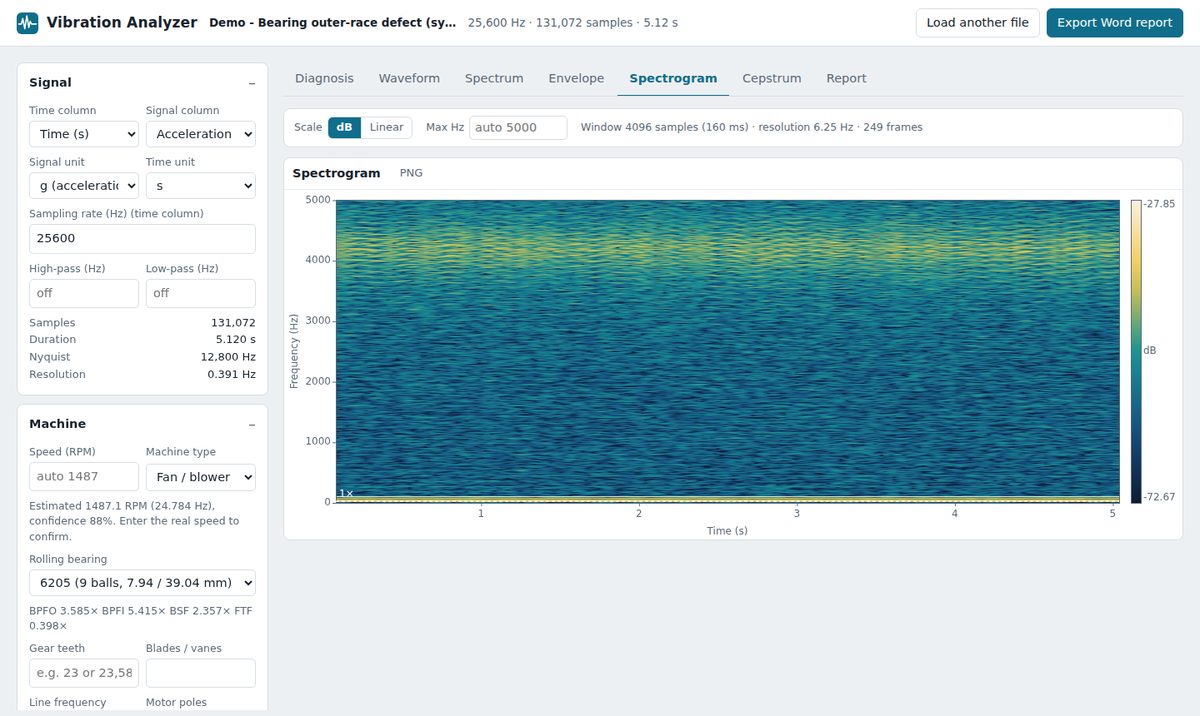
Screenshot: spectrogram view

Step 5

See how the signal changes over time

The spectrogram shows frequency content over time, and the cepstrum turns repeating spacings into single peaks.

  • Spot speed changes and intermittent events
  • Find sideband and harmonic spacings as cepstrum peaks
  • Useful for gearboxes and other modulated signals
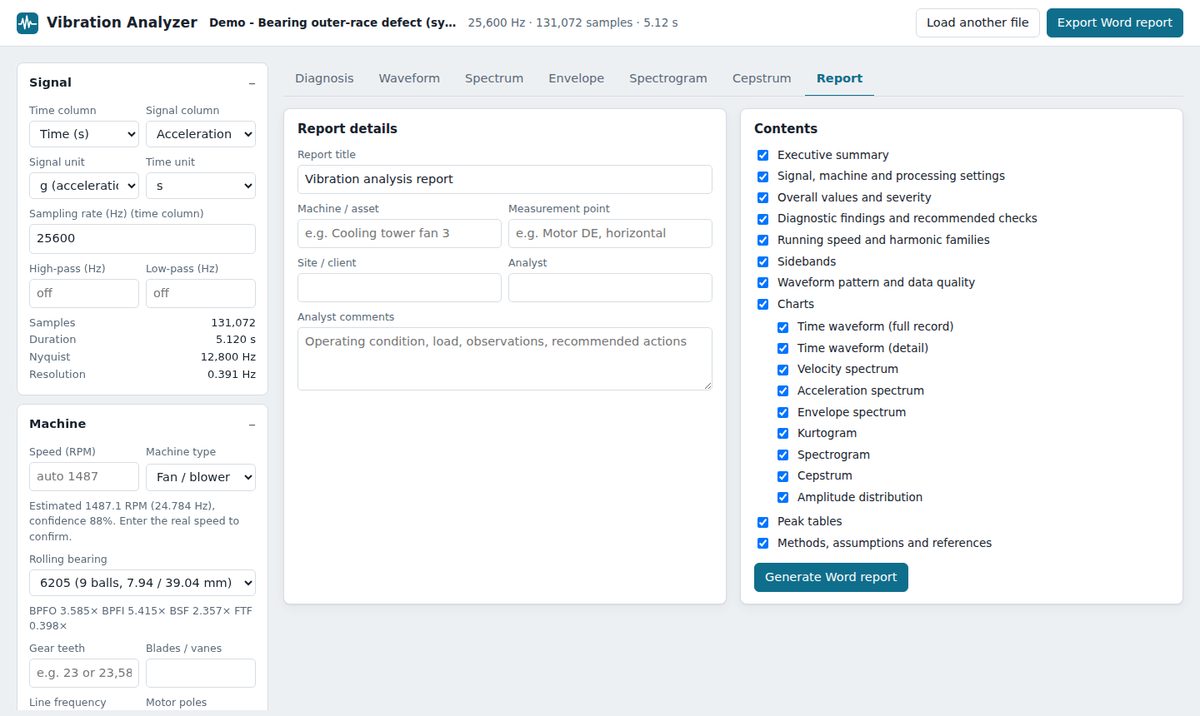
Screenshot: report tab

Step 6

Export a Word report

Turn the analysis into a report you can share, without retyping anything.

  • Add title, asset, measurement point, site and analyst
  • Choose which sections to include
  • Add your own comments, then export a .docx file

Get the analyzer

Request your copy

Enter your name and email in the form and the analyzer will be sent to you by email.

  • A single HTML file, opens in any modern browser
  • Works on your own data, which stays on your computer
  • Demo signals included so you can try it straight away

The request form is not available yet. Email to request the analyzer.

Request by email